Target: +15% annual return | 25–30% max drawdown.
Tired of following unverified “gurus” with no proven track record? Live track record verified via FundSeeder.com – MarketKangaroo (Top 2%).
I will send you at least one daily email. I will also contact you through Substack Posts.


My Portfolio of Two Systems
Combined metrics with anual rebalance since 01/01/2008
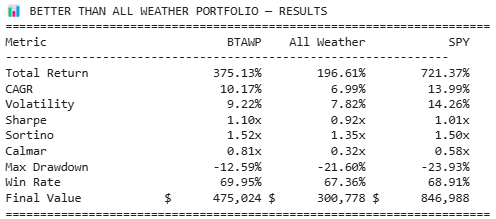
- CAGR 17% vs 11% S&P 500
- Max. DD Month close: -15% vs -46% S&P 500
- Max. DD Intraday (aprox.) -25% vs 55% S&P 500
- Sharpe: 1,29 vs 0,74 S&P 500
- Correlation: 0,43 vs S&P 500
- MonteCarlo 5th percentile 60 months ahead with 100k: 125k 2 systems vs 90k S&P 500
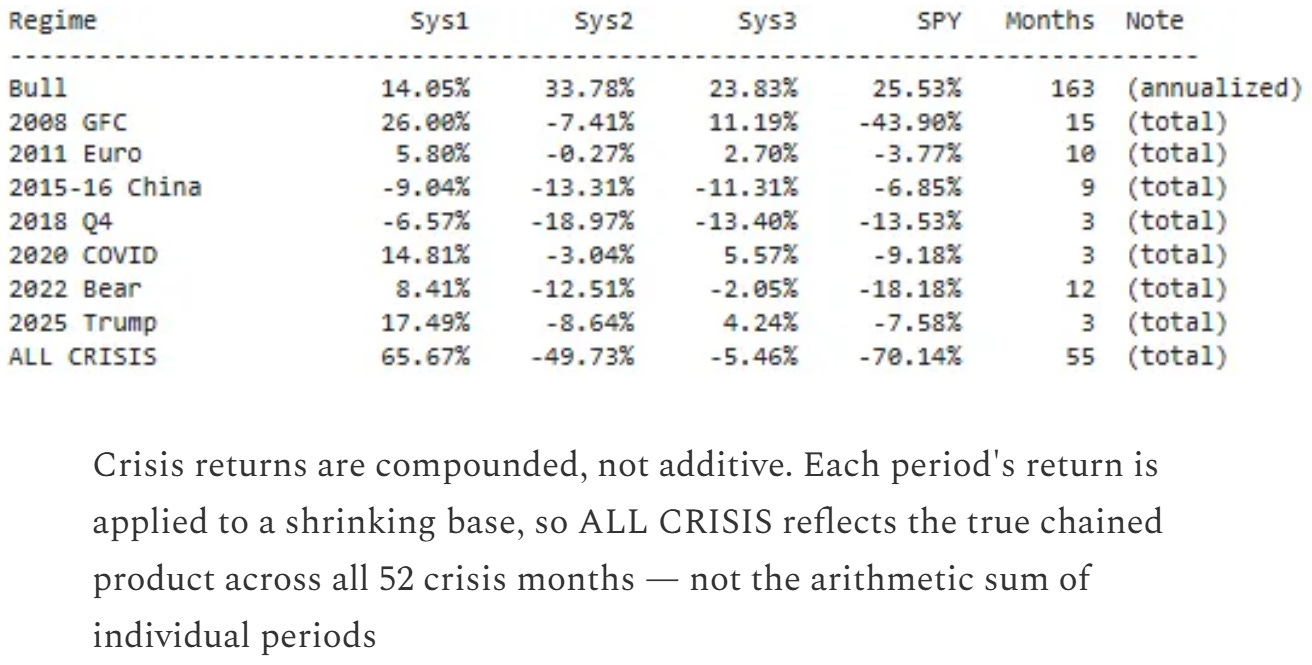
- Stress Test (see image).
My Low Risk Strategy
Backtested since 2010. DD monthly close.
Full Backtests Include:
- Equity Curve & Drawdown (monthly close)
- Returns and Volatility Deep Dive
- Correlation Deep Analyisis
- Other ratios (Sharpe, etc)
- Monte Carlo Simulation – 5 years / 60 Months
- Walk forward (private, not shared). Reduces overfitting. (S1)
- Transaction Cost Impact (S1)
- Regime Analysis
- CVaR / TAIL RISK
- Stress Test
